AstroImageJ
ImageJ is a graphical user interface (GUI) driven, public domain, Java-based, software package for general image processing traditionally used mainly in life sciences fields. AstroImageJ (AIJ) is an extension of ImageJ which provides an astronomy specific image display environment and tools for astronomy specific image calibration and data reduction. Although AIJ maintains the general purpose image processing capabilities of ImageJ, AIJ is streamlined for time-series differential photometry, light curve detrending and fitting, and light curve plotting, especially for applications requiring ultra-precise light curves (e.g., exoplanet transits). AIJ reads and writes standard FITS files, as well as other common image formats, provides FITS header viewing and editing, and is World Coordinate System (WCS) aware, including an automated interface to the astrometry.net web portal for plate solving images. AIJ provides research grade image calibration and analysis tools with a GUI driven approach, and easily installed cross-platform compatibility. It enables new users, even at the level of undergraduate student, high school student, or amateur astronomer, to quickly start processing, modeling, and plotting astronomical image data with one tightly integrated software package. AIJ is available for download, along with a user guide and a support forum. AIJ functionality is described in an Astronomical Journal article and an expanded edition of the article describes in more detail the program functionality and operation of the user interface.
AstroImageJ features include:
- Interactive astronomical image display supporting multiple image stacks with fast image zooming and panning, high-precision contrast adjustment, and pixel data display similar to SAOImage DS9
- Live mouse pointer photometer
- Sky orientation of image and pixel scale display in a non-destructive image overlay
- Reads and writes FITS images with standard headers, as well as most other common image formats (e.g. tiff, jpeg, png, etc.)
- Data Processor facility for image calibration including bias, dark, flat, and non-linearity correction with an option to run in real-time during observations
- Interactive time-series multi-aperture differential photometry with detrend parameter extraction, and an option to run in real-time during observations
- Photometric uncertainty calculations including source and sky Poisson noise, dark current, detector readout noise, and quantization noise, with automatic propagation of single-aperture uncertainties through differential photometry, normalization, and magnitude calculations
- Comparison star ensemble changes without re-running differential photometry
- Interactive multi-curve plotting streamlined for display of light curves
- Interactive light curve fitting with simultaneous detrending
- Plate solving and addition of WCS headers to images seamlessly using the Astrometry.net web interface
- Time and coordinate conversion with capability to update/enhance FITS header content (airmass, BJD_TDB, etc.)
- Point and click radial profile (i.e. seeing profile) plots
- FITS header viewing and editing
- Astronomical coordinate display for images with WCS
- Object identification via an embedded SIMBAD interface
- Image alignment using WCS headers or apertures to correlate stars
- Non-destructive object annotations/labels using FITS header keywords
- Mathematical operations of one image on another or an image stack, and mathematical and logical operations on single images or image stacks
- Color image creation
- Optionally enter reference star apparent magnitudes to calculate target star magnitudes automatically
- Optionally create Minor Planet Center (MPC) format for direct submission of data to the MPC
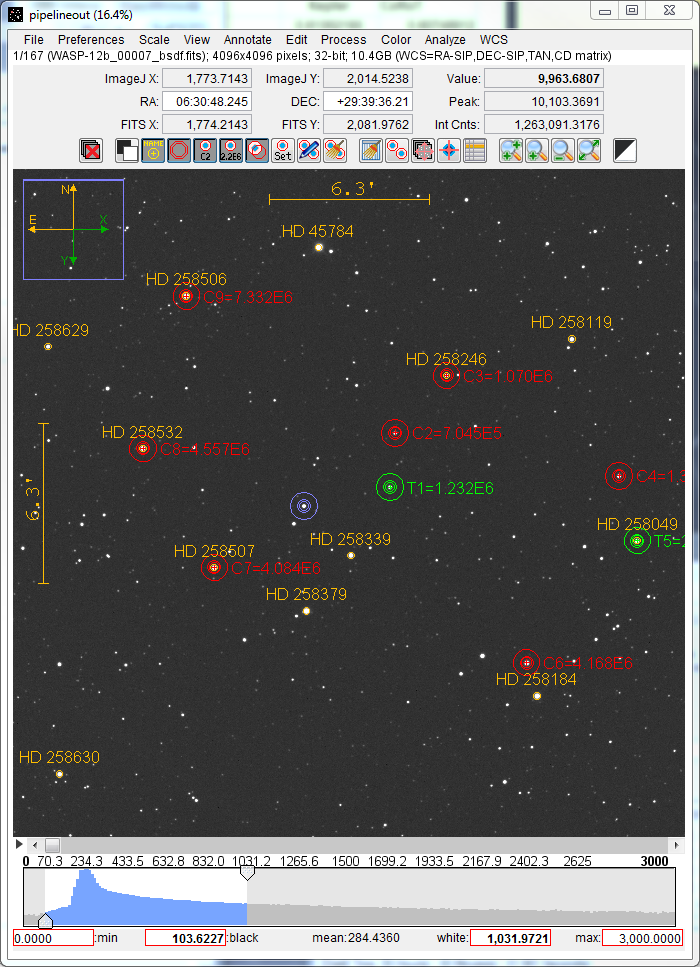
An example of AIJ's image display is shown below, including apertures for differential photometry (red and green), non-destructive annotations (yellow), image plate scale, directional arrows, and a live photometer that optionally moves with the mouse cursor. Image contrast (scaling) is easily adjusted using the histogram area below the image. The scroll bar under the image selects an image for display from a time-series.
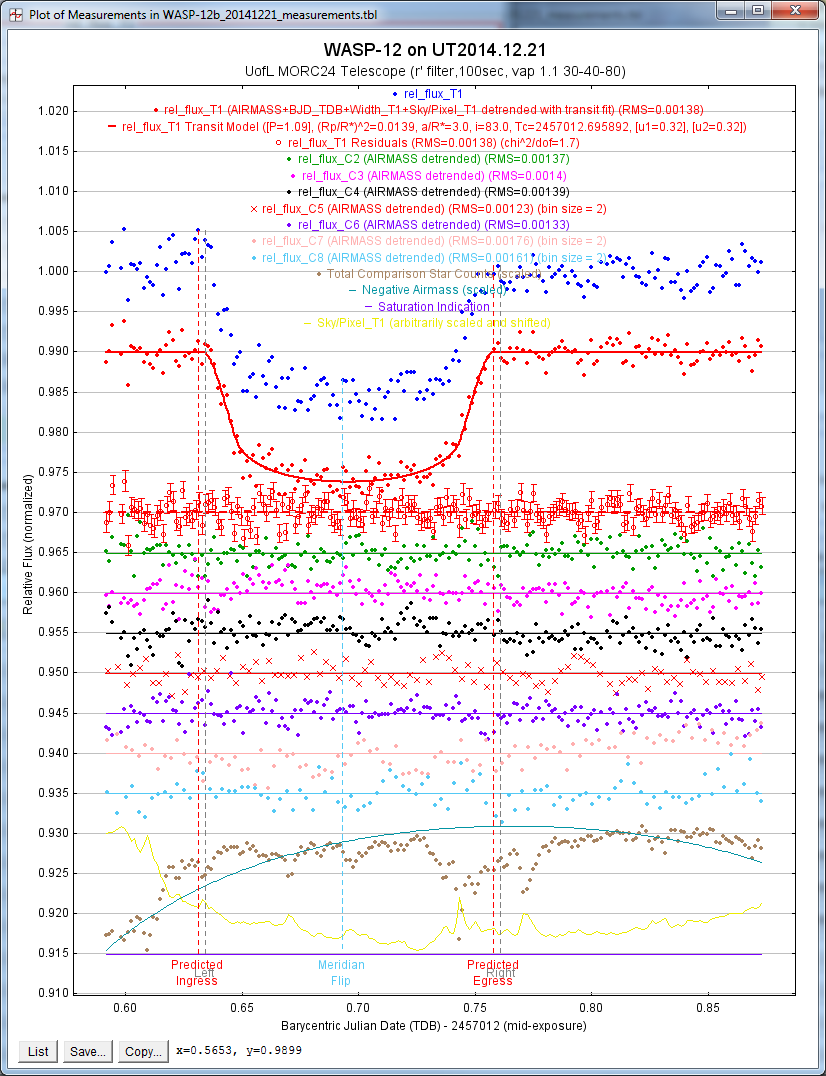
The integrated plotting and light curve facilities provide for multi-curve plots of light curve data, light curve models, and residuals.
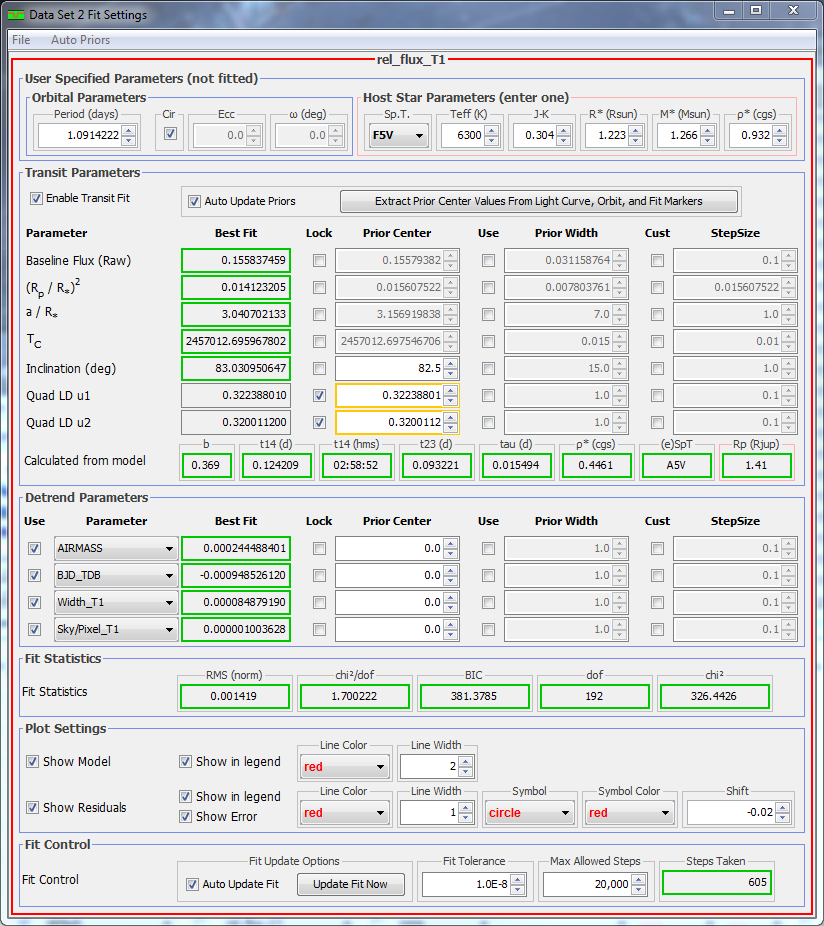
The light curve and detrending interface is shown below. The interface provides for near-automatic light curve fitting. However, parameters can be locked to a specific values or restricted to take on values within an expected range (i.e. priors). Various fitting statistics are provided to aide in the selection of detrend parameters.
Contact: Karen Collins.