Hypatia Catalog Database
The Hypatia Catalog Database (www.hypatiacatalog.com) is the largest database of high resolution stellar abundances for stars within the solar neighborhood. It currently offers >70 elements and species within >6,000 stars, where >350 stars are host planets. The Hypatia Catalog Database features an interactive table and multiple plotting interfaces that allow easy access and exploration of stellar abundance data and properties within the Hypatia Catalog.
The Hypatia Catalog is a multidimensional, amalgamate dataset comprised of stellar abundance measurements for FGKM-type stars within 150 pc of the Sun from carefully culled from hundreds of literature sources that measured both [Fe/H] and at least one other element. In addition to abundances, stellar properties and planetary properties, where applicable, have been made available within the Hypatia Catalog Database. Data can be plotted or directly downloaded through the website for use in personal plotting routines. A user's guide has been published on arXiv.
Hypatia Catalog Database features include:
- Generate scatter plots of stellar abundances, stellar properties, and planet properties on the "Elements & Properties" tab
- Produce histograms comparing chemical and physical properties in stars that are known to host planets and those that are not on the "Stars With/Without Planets" tab
- Change solar normalization of abundances to a standard baseline or the individual values used by each respective literature dataset
- Vary the way to handle when an element ratio is in multiple datasets (mean or median)
- Include all literature sources or only specific datasets
- Interact directly with the data: drag to zoom, highlight specific data points, hover to get more info
- View all abundances, stellar properties, and planet properties in tabular format
- Directly save plots (png, pdf) and data (html, csv, tsv)
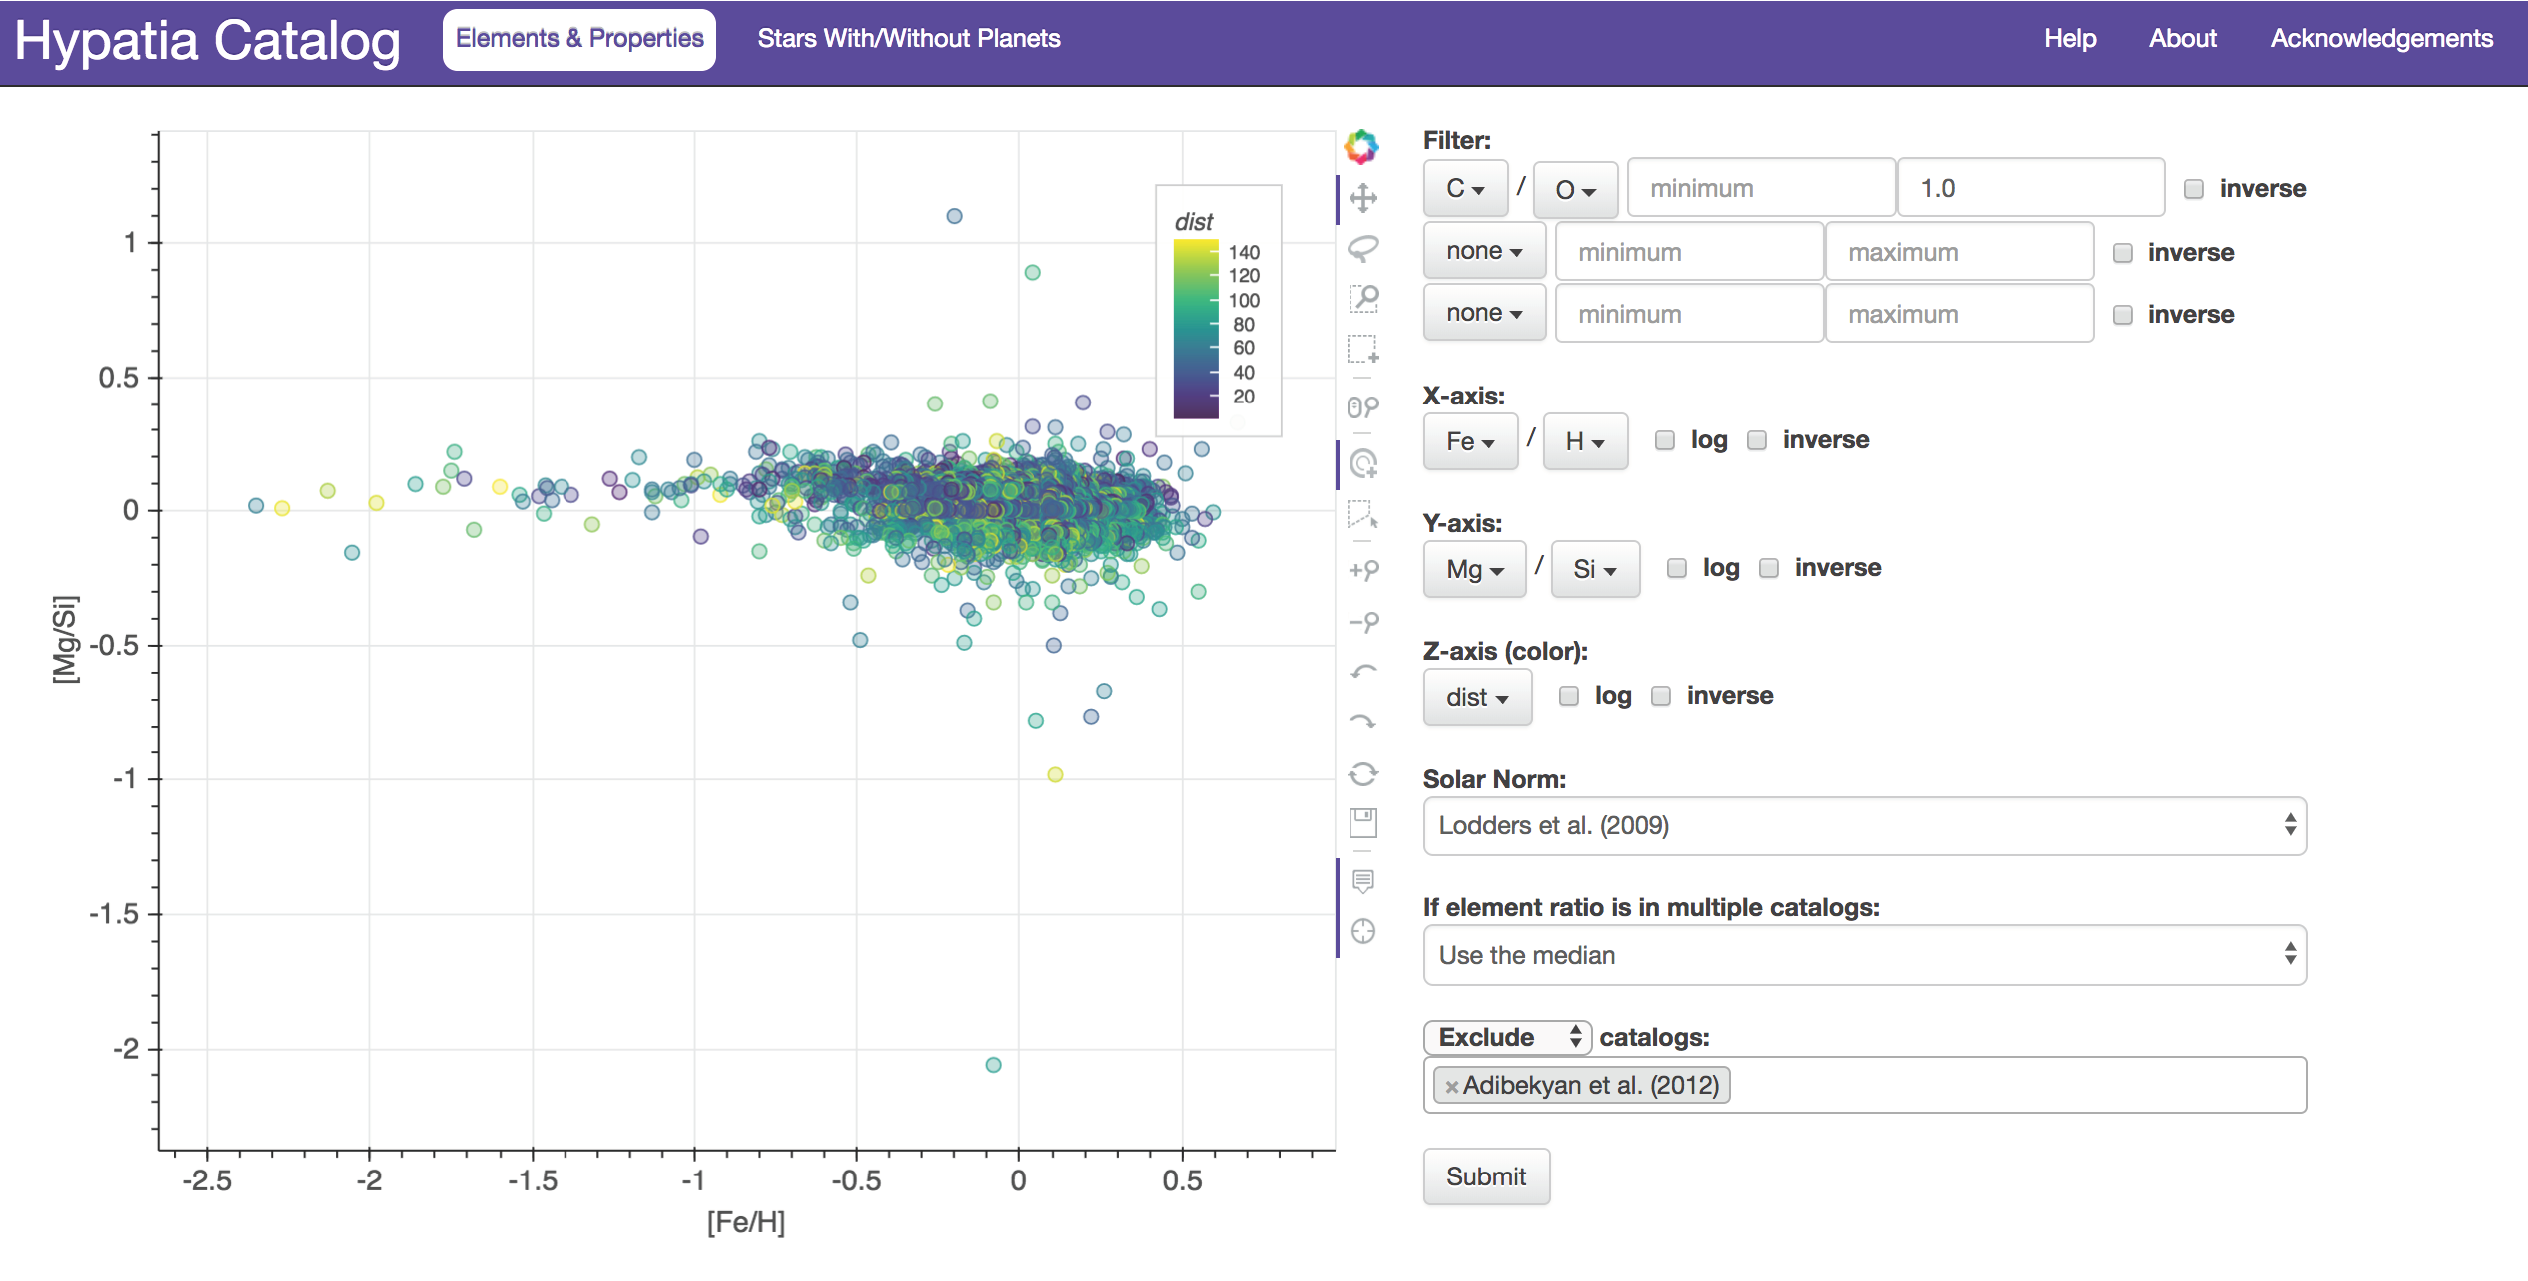
From the Hypatia Catalog Database, example plot on the "Elements & Properties" tab showing how to use the filter, vary the X- and Y-axes, and include a color bar on the Z-axis.